A great question came up over at DBA.StackExchange regarding the query store reports time intervals:
How can SQL Server’s Query Store Reports show data for minute-length intervals, when “Statistics Collection Interval” is set to 1 hour?
I was intrigued because it’s not something I had thought about at all.
How Does the Report Decided on Time?
The first thing you need to know is that all performance information inside Query Store is aggregated. By default, the aggregation interval is 60 minutes. You can adjust that up or down (although, I wouldn’t recommend making it too granular, you’ll see a massive increase in storage size). It’s aggregated because trying to capture every execution of every query, as anyone who has done it using Extended Events knows, is expensive and has a massive storage requirement. The reason the aggregations are split up into intervals is so that you can see before and after measurements, meaning, before today and after today, before I added an index and after, etc..
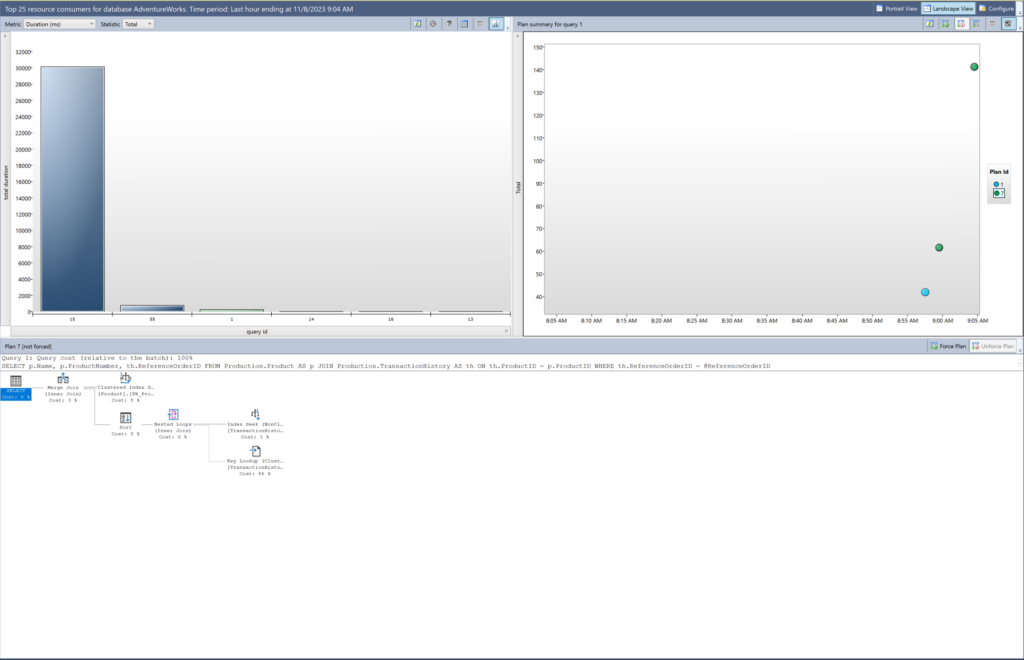
OK, that established, there are reports (handy things they are too) within Management Studio, that show you stuff like the top resource consuming queries:

Over on the extreme right side of the window are some buttons:

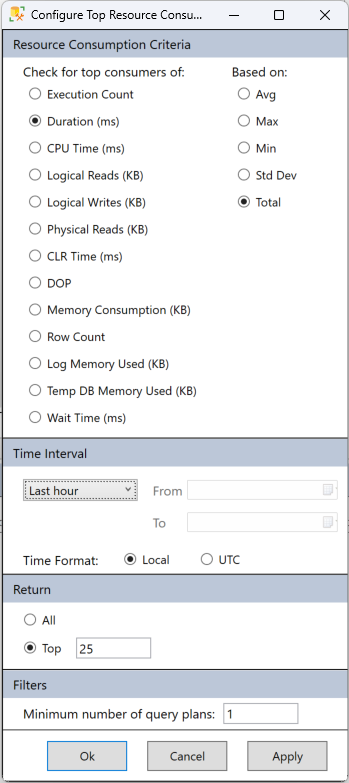
The one we’re interested in is Configure. It includes a bunch of filtering including the time interval being shown:

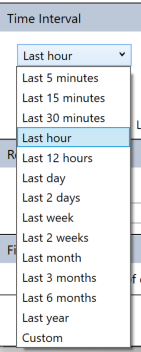
The thing we want to focus on here is the Time Interval:

So, we can filter down to five minutes. Heck, you can put in a custom filter and go down to one minute. But… Isn’t the data aggregated by 60 minutes? How on earth can we see the last five minutes when the data is aggregated?
The answer is in the query, which Matthias, the person who asked went and captured:
SELECT TOP (@results_row_count)
    p.query_id query_id
    , q.object_id object_id
    , ISNULL(OBJECT_NAME(q.object_id),'') object_name
    , qt.query_sql_text query_sql_text
    , ROUND(CONVERT(float, SUM(rs.avg_duration*rs.count_executions))*0.001,2) total_duration
    , SUM(rs.count_executions) count_executions
    , COUNT(distinct p.plan_id) num_plans
FROM sys.query_store_runtime_stats rs
JOIN sys.query_store_plan p ON p.plan_id = rs.plan_id
JOIN sys.query_store_query q ON q.query_id = p.query_id
JOIN sys.query_store_query_text qt ON q.query_text_id = qt.query_text_id
WHERE NOT (rs.first_execution_time > @interval_end_time OR rs.last_execution_time < @interval_start_time)
GROUP BY p.query_id, qt.query_sql_text, q.object_id
HAVING COUNT(distinct p.plan_id) >= 1
ORDER BY total_duration DESC
The key is right here: WHERE NOT (rs.first_execution_time > @interval_end_time OR rs.last_execution_time < @interval_start_time).
What you’re getting is the queries that have their first_execution_time or their last_execution_time wihin the aggregation, that will show up. However, what you’re not going to see is a count of executions for a five minute interval. Instead, you’ll see the count of executions for the entire, 60 minute interval that meets the filtered criteria. So, the data may look… bad. It’s not. Just know what you’re looking at.
Conclusion
This isn’t meant as a critique of the reports. I like them. It’s just a question of you need to know what data is being stored in Query Store so that you understand the information you’re looking at. There isn’t a second, more granular, data set within Query Store, just the aggregation.