Wouldn’t it be great to just quickly and easily take a look at your system to see if you had any queries that ran for a long time, but, without actually doing any work to capture query metrics?
Oh, yeah, I can do that right now, and so can you.
All we need is something that is built into every single server you currently have under management (sorry, not Azure SQL Database) that is SQL Server 2008 or better: system_health
system_health Extended Event Session
The system_health Extended Events session is very well documented by Microsoft here. I’ve talked about it before, in relation to Azure SQL Database, and, on the same topic we’re going over today, long running queries and waits (cause if you have a long running query, you have waits). However, today, I want to drill down a little on two things, exactly what is being captured by the system_health in relation to wait statistics, and, how it does this little bit of magic.
We can use the GUI to take a look at how the event is configured, but it’s much easier to see in the code:
...ADD EVENT sqlos.wait_info
    (ACTION
     (
         package0.callstack,
         sqlserver.session_id,
         sqlserver.sql_text
     )
     WHERE (
               [duration] > (15000)
               AND
               (
                   [wait_type] >= N'LATCH_NL'
                   AND
                   (
                       [wait_type] >= N'PAGELATCH_NL'
                       AND [wait_type] <= N'PAGELATCH_DT'
                       OR [wait_type] <= N'LATCH_DT'
                       OR [wait_type] >= N'PAGEIOLATCH_NL'
                          AND [wait_type] <= N'PAGEIOLATCH_DT'
                       OR [wait_type] >= N'IO_COMPLETION'
                          AND [wait_type] <= N'NETWORK_IO'
                       OR [wait_type] = N'RESOURCE_SEMAPHORE'
                       OR [wait_type] = N'SOS_WORKER'
                       OR [wait_type] >= N'FCB_REPLICA_WRITE'
                          AND [wait_type] <= N'WRITELOG'
                       OR [wait_type] = N'CMEMTHREAD'
                       OR [wait_type] = N'TRACEWRITE'
                       OR [wait_type] = N'RESOURCE_SEMAPHORE_MUTEX'
                   )
                   OR [duration] > (30000)
                      AND [wait_type] <= N'LCK_M_RX_X'
               )
           )
    ),...
The key points are, we’re looking at a duration greater than 15,000 microseconds and then a bunch of filters to eliminate waits that are meaningless, or, we’re looking at greater than 30,000 microseconds and then another filter.
That’s it. That’s the magic in a single statement. However, there is a little more to it. Note at the top where we add a few ACTIONs to the event:
- package0.callstack
- sqlserver.session_id
- sqlserver.sql_text
An Action within Extended Events allows you to add information that is not otherwise included in the Event package itself. Understand, Actions are not free. They can come with some overhead, possibly even significant overhead, but, used judiciously, they add functionality.
The sql_os.wait_info package only captures a few pieces of information by default:
- duration
- opcode
- signal_duration
- wait_resource
- wait_type
However, by adding the call stack and the sql text, we now get the golden info, which query caused this wait that lasted longer than 15-30 seconds. Here’s an example where I started a pair of transactions without a commit:
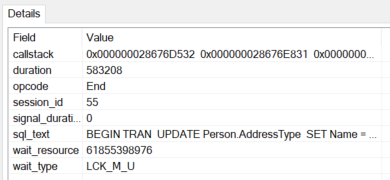
Because I can add the session_id and the sql_text to the information gathered by the Extended Event, I’ve got a more complete picture than I can possibly get anywhere else.
How to Get The system_health Information
In the other example I link to above, I show how to query the XML to retrieve this data. Honestly, that’s still my preferred method, but, I know that querying XML is an utter pain in the you know what. So, is there another way to easily get this data? Otherwise, this is a pleasant exercise.
Yes.
You just have to get access to the system_health output file from SSMS. How exactly you do that, is on you. However, once you can open it in SSMS, which is just a matter of double clicking on the system_health_* file, you’ll get the following:
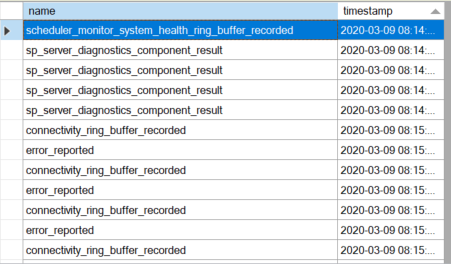
This is the full listing of events from the system_health session. Let’s take advantage of our SSMS tool here and click on the “Filters button:

Clicking that button opens this window, which I’ve already set up to get the wait_info events:
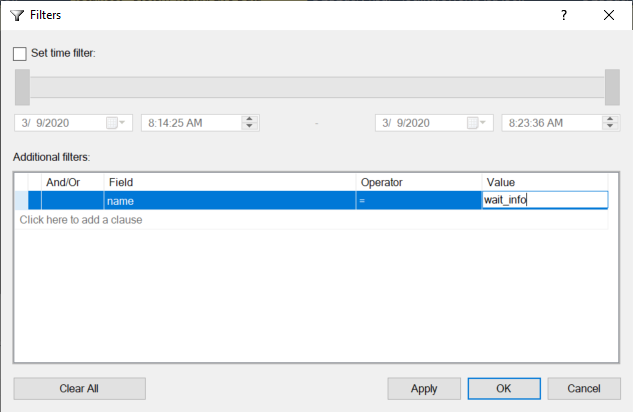
As you can see, you can filter by a time range as well as add all sorts of other filters. In my case, I’m simply using a simple search to find all events named ‘wait_info’:
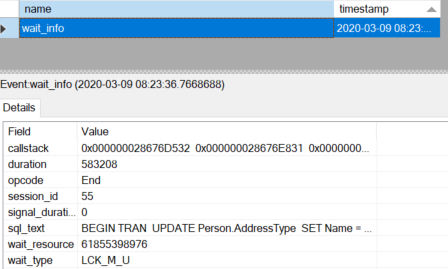
This is a test system, so I only had the one occurrence to worry about. On a production system I might need to filter the dates & times down to a specific range, or I might add other filters, looking at specific wait types, query text, whatever.
You Can’t Do That In Profiler
The ability to decide to add an Action to a given event makes it so that you can change the behavior of the event itself. Microsoft designed this into the system and then implemented it in their own code, system_health. You simply cannot capture this kind of information in Trace/Profiler. You would need to capture waits, which you can do, and queries, which you can do, but then find a way to match them up, maybe by duration, call times, etc. However, no matter what, especially on a production system, you could not possibly match the specific wait, for certain, to a specific query. You absolutely can with Extended Events.
It has to be repeated. Extended Events are not simply a better way to capture query metrics. Extended Events represent new functionality that simply cannot be replicated within Profiler. I mean, there’s not even a waits event in Profiler, but more importantly, you can’t use something like Actions to change the behavior of a given event.
I’m happy to put on an ad hoc class on Extended Events at any event you find me. Just ask. However, if you really want to dig in to this topic with me, I have an all day course available.
I’ll be teaching Query Store, Extended Events and Execution Plans along with a few other things at SQLIntersection this spring:
On the other hand, if you want to talk DevOps, I have an all day class at Bits:
[…] Grant Fritchey shows us where we can find long-running queries easily: […]
Hi Grant,
First, thanks for the Red Gate streaming session :).
I am working with EE now (we finally upgraded from 2008R2 to 2017).
I am confused by the large conditional on Wait_Type. Are the conditions literally just alpahbetic comparisons (e.g. N’IO_Completion < N'PageIOLatch_Ex') or is there some magic I don't see?
Would I break this session if I reordered the conditions to "alphabetize' the tests in ascending order?
Also, I am trying to meld this code with your session in "EXTENDED EVENTS: QUERIES AND WAITS", I don't want to mess with System_Health. I find that the amout of data quickly grows to unmangageable size (more than 5 minutes for grouping to complete on 5 minutes of data collection). Is there a way to filter beyond the database level?
I wouldn’t recommend editing the system_health session. You can copy stuff out and recreate it. Sure you can filter by more than the database. Just add AND clauses like you see above. As to reordering them, if you notice it’s a mix of OR and AND, so the order for some of them, but not all of them, will matter here, like any query.
Very good explanation about the system_health internal query
Thank you.