I place a lot of emphasis on capturing actual execution plans because of the runtime metrics, but with Trace Flag 7412, we don’t need the plan. This is great news, because capturing execution plans, even using extended events, is an expensive proposition. However, using either the query_thread_profile event, or, Trace Flag 7412, we can get the runtime metrics without the plan.
Trace Flag 7412
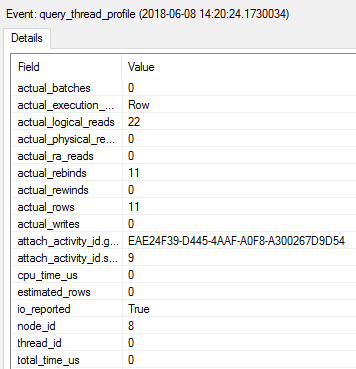
Here’s how it works.You can either be running the extended event, query_thread_profile (a debug event, but one documented and supported by Microsoft) or, enable the Trace Flag 7412. I like to use the extended event in a targeted fashion to easily see behaviors on a query without having to capture the plan. You can even capture the information and then combine it with an estimated plan from the Query Store to coordinate it with the operators, because, as you can see below, the NodeID is captured along with all the great information:
But, what about long running queries? Do you have to wait until the end of execution to see the data? Nope. With the Trace Flag enabled, we can query sys.dm_exec_query_profiles. This returns basically the same information. Here’s an example query that we could use with an execution plan to see estimated versus actual, as the query runs:
SELECT deqp.session_id,
       deqp.node_id,
       deqp.physical_operator_name,
       deqp.estimate_row_count,
       deqp.actual_read_row_count
FROM sys.dm_exec_query_profiles AS deqp;
Now that’s VERY exciting stuff. Runtime metrics like we were capturing an execution plan, but without capturing an execution plan. It gets better.
Live Execution Plans
Starting in SQL Server 2014, we had the ability to look at live execution plans through the data supplied by sys.dm_exec_query_statistics_xml. However, it required that we capture the plans to see the information. It’s nice, but it’s not great. Let’s say you’re in the situation where you suddenly get a phone call, “My query is slow.” You can’t go turn this on unless you’re already capturing plans. However, capturing plans is bloody expensive, so you can’t just capture every plan all the time.
Enter Trace Flag 7412.
If you have Trace Flag 7412 enabled, or, you’re capturing the query_thread_profile extended event, you also will ALWAYS have access to live execution plans. That’s right. When the phone call comes in, you just open up a tool, say Activity Monitor, and you can immediately see the live execution plan showing the processing metrics as the query is running. No additional execution plan capture set up ahead of time needed.
Conclusion
Now, don’t immediately go and enable Trace Flag 7412 on all your servers. While capturing these statistics are lightweight, especially when compared to capturing execution plans, they are not, no weight. Capturing this information adds load to the system. However, it might load that we’re willing to put up for the reward of on-demand live execution plans.
If you like learning about ways to make query tuning easier, then you don’t want to miss my all day seminar on the topic. I’m taking this show on the road, around the world. Please find something near by and register:
For SQLSaturday Indianapolis (and my first time speaking in Indiana) on August 10, 2018. Please go here to sign up.
I’ll be at SQLSaturday Sioux Falls (and my first time speaking in South Dakota) on August 18, 2018. Please sign up here.
For SQLSaturday Oslo on August 31, 2018. Click here right now to register.
Newly announced, SQLSaturday Boston on September 21st. You can go here to register.
[…] Grant Fritchey shows a lightweight way of capturing plan metrics: […]
Hi Grant,
I enabled traceflag 7412 and then used PlanExplorer. I was able to see live changes in query plan during the execution. However, once the query execution finished, I got a message saying this:
A query plan was not collected at the time of statement execution. Estimated plan generation is only available for non-dynamic root statements on SQL Server 2005 and higher.
I also tried to view through the activity Monitor and I was not able to see the dynamic plan.
Can you please tell me if the first message is because of the PlanExplorer tool and if there is another way to view the dynamic query execution plan?
As a side note, it was amazing to see the live changes happening on the plan in plan explorer.
Thanks.
I don’t know how all this works with Plan Explorer. Sorry.
ok. I have an update on Plan Explorer. I installed the latest version 3.0 (Build 18.4.0.0) and the issue went away. Now the plan explorer shows the plan in progress AND it shows the plan after the query is completed.
I am already a fan of this Traceflag 7412. Thanks for sharing the knowledge Grant.
Good to know. Thanks for sharing.
[…] mentioning is using the Live Execution Plans, or more accurately, live query metrics. I’ve written about that before too. The easy way, enable Trace Flag 7412. The harder, but not hard, way, capture the […]