Capturing query execution metrics is much easier now that you can see the runtime metrics in execution plans when you’re using SQL Server 2016 SP1 or better in combination with SQL Server Management Studio 2017. When you capture an actual plan (using any method), you get the query execution time on the server as well as wait statistics and I/O for the query. Fundamentally, this changes how we can go about query tuning.
Runtime Metrics
To see these runtime metrics in action, let’s start with a query:
SELECT p.LastName,
pp.PhoneNumber,
pnt.Name
FROM Person.Person AS p
JOIN Person.PersonPhone AS pp
ON pp.BusinessEntityID = p.BusinessEntityID
JOIN Person.PhoneNumberType AS pnt
ON pnt.PhoneNumberTypeID = pp.PhoneNumberTypeID
WHERE pnt.PhoneNumberTypeID = 3;
We’ll run this query and capture the Actual Execution Plan using SSMS 2017. The changes are not immediately apparent. Here is a screen capture of the plan and one of the tooltips. You won’t see anything new here (click to make big):
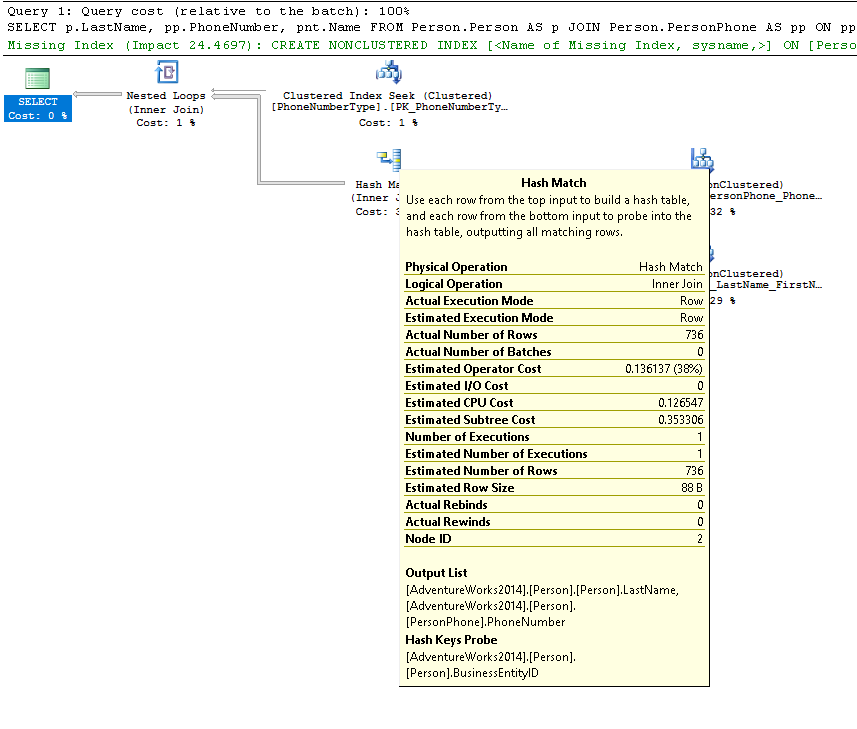
Instead, you need to go into the properties of the operators (which, you should get into the habit of doing anyway). Here are some of the properties of the SELECT operator, showing off some exciting new information:
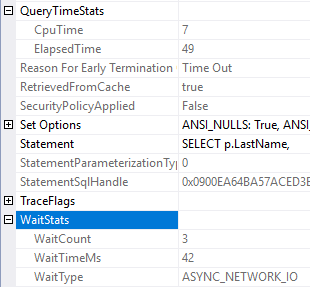
At the very top you can see the QueryTimeStats showing CpuTime and ElapsedTime, 7ms and 49ms respectively. At the bottom you can see that there are WaitStats showing 3 waits of 42ms and a wait type of ASYNC_NETWORK_IO.
Excited?
Let’s see some of the properties of the Index Scan operator from this plan:
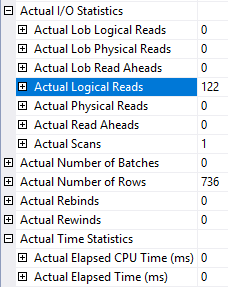
You can see that you have a full set of the Reads for the query. In this case, 122 logical reads and no physical reads (I’d run the query a couple of times getting things together for this blog post, so everything was in memory). At the bottom you can also see the Time measurements. In this case the value is zero, when measured in milliseconds.
Now, we all know that a single run of a query sometimes doesn’t accurately reflect it’s general behavior. Capturing runtime metrics for a single run won’t always satisfy our tuning needs. For that, we can still use Extended Events to aggregate a series of runs.
Conclusion
In short, we have most of everything we need to see when we’re trying to capture runtime metrics for a query. No longer will we need to SET STATISTICS IO (which can cause problems anyway) and SET STATISTICS TIME or swap back & forth to Extended Events. These runtime metrics included with the plan even mean that we get to pass the data along to someone else when we share the plan. This is very useful stuff.
Want to learn more about tools that make query tuning easier. I have a full day pre-con coming up in October at DevConnections on the 22nd. Go here to get registered now.
Bad news – it’s not anywhere near accurate: https://www.brentozar.com/archive/2017/07/sql-2016-sp1-shows-wait-stats-execution-plans/
OK wait stats s*ck apparently, but what about logical reads and elapsed time? Can I stop using “set statistics io/time”?
From what I’ve seen and measured, yeah.
[…] mechanism to capture query wait statistics is to use an Actual Execution plan. This method is great in that it captures the query wait statistics for a single query. However, […]