If you get an execution plan that looks like this:
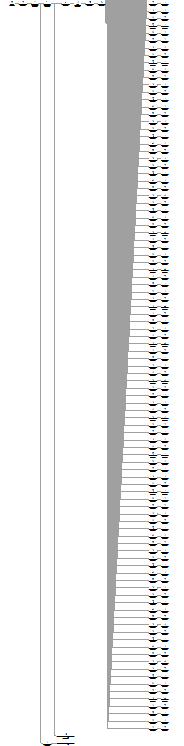
I wouldn’t blame you for immediately thinking about query tuning. Especially if the code that generated it looks like this:
SELECT  soh.OrderDate,
        sod.OrderQty,
        sod.LineTotal
FROM    Sales.SalesOrderHeader AS soh
INNER JOIN Sales.SalesOrderDetail AS sod
        ON sod.SalesOrderID = soh.SalesOrderID
WHERE   soh.SalesOrderID IN (@p1, @p2, @p3, @p4, @p5, @p6, @p7, @p8, @p9, @p10,
                             @p11, @p12, @p13, @p14, @p15, @p16, @p17, @p18,
                             @p19, @p20, @p21, @p22, @p23, @p24, @p25, @p26,
                             @p27, @p28, @p29, @p30, @p31, @p32, @p33, @p34,
                             @p35, @p36, @p37, @p38, @p39, @p40, @p41, @p42,
                             @p43, @p44, @p45, @p46, @p47, @p48, @p49, @p50,
                             @p51, @p52, @p53, @p54, @p55, @p56, @p57, @p58,
                             @p59, @p60, @p61, @p62, @p63, @p64, @p65, @p66,
                             @p67, @p68, @p69, @p70, @p71, @p72, @p73, @p74,
                             @p75, @p76, @p77, @p78, @p79, @p80, @p81, @p82,
                             @p83, @p84, @p85, @p86, @p87, @p88, @p89, @p90,
                             @p91, @p92, @p93, @p94, @p95, @p96, @p97, @p98,
                             @p99);
Let’s replace this with a table variable, maybe even one passed in as a parameter. The plan then looks like this:
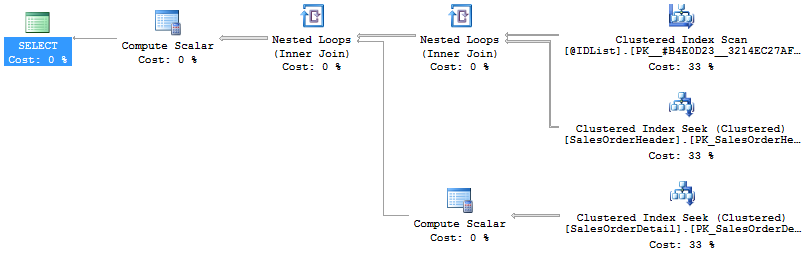
Ah, much prettier. I’m happy now, all’s right with the world… But, just in case, let’s look at performance. The first query ran in about 2.2ms and had 599 reads. The second query ran in about 24ms and had 598 reads… crud.
Well, let’s modify everything again. Instead of a table variable, we’ll use a temporary table and get some statistics into this puppy which will clean things right up. Here’s the new plan:
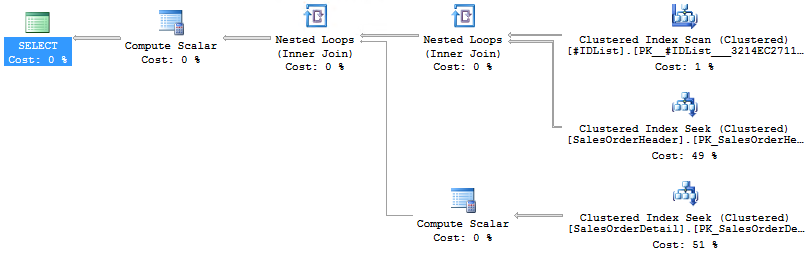
Looks pretty familiar, although there are slight differences in the cost estimates between this plan and the preceding one. But the run time is 85ms with 714 reads AND I had to create the temporary table which added time to the whole thing.
Doggone it, that other plan is heinous and ugly and so is the query which uses an IN clause. Shouldn’t the cleaner, simpler, execution plan be an indicator that we’re going to get better performance?
Nope.
The thing is, just because the execution plan is simple and easy to understand does not mean it’s going to perform well. You can’t simply look to an execution plan to understand performance. You have to measure the run times on the query, look to the resources it’s going to use in order to understand where waits are likely, look at it’s reads, and take all this into account, along with understanding what the execution plan is doing in order to make the appropriate choices for performance on your system.
UPDATE:
I kept working with this because I was convinced I could get faster performance. The main difference as I saw it was that the optimizer sorted the data in the IN clause and I wasn’t explicitly sorting the data in any of my replacement queries. But nothing I did resulted in better execution times. And that was upsetting.
First, when you’re tuning a query, you’re going to look at the execution plans, as I did above. But, when you want to measure the performance of queries, it’s a very good idea to turn off execution plans and just capture the query metrics. I knew this and was doing it and you could see the results in the Extended Events where I was capturing each statement for the SPID I was working within. I also had the SET STATISTICS IO and SET STATISTICS TIME enabled for the query. Since each execution would cause those to fire as part of the statements and those were making my  ExEvents window messy, I decided to turn them off… WHOA! Query execution times radically changed.
In fact, my first attempt at tuning the query, substituting a table parameter, was suddenly faster than the original. The fastest was when I pre-sorted the data in a temporary table (discounting the costs of sorting and inserting the data into the temp table just for the moment). In fact, the prettiest plan was indeed the fastest.
Experimenting further, it was the STATISTICS IO that completely changed the execution times.
In short, pay no attention to my original post above, instead, let the lesson be that I need to be very cautious about the Observer Effect.
that…. is evil.
Sure surprised me.
[…] post “Pretty Plans vs. Performance” or “Grant Gets Pwned” appeared first on Home Of The Scary […]
Well, as Richard Feynman famously said, even a failed experiment can provide valuable insights if you approach it from the right perspective. This is a very interesting post. Thank you! 🙂
Grant, so the upshot of the whole thing is that if the measurement methods impose overhead then the results could be skewed. What then is the optimal method to use for collecting metrics, straight forward running them side by side with Statistcs Time On and looking at the empirical results? Seems like the answer you are suggesting for this. Although you discounted the cost of populating the temp table it would be included in the total time. In having run into similar situations there are radically different times when using table variables and temp tables but it really depends on amount of rows that you are working with, need for ordering in these data sets, etc. For extremely large data sets just loading the data into temp tables could be slower than into table variables until you spill to temp db if that happens. I have also seen where an IN clause is used but it contains a select which results in millions of values that have to be sorted before they can be useful in the predicate, I replaced this with join on a table variable with a clustered index via constraint. Cut the time in half even with the insert and index create.
Just some rambling thoughts but really wanted to know if the empirical run times were simplest methodology excluding other parameters. In the modern data center you have virtualized everything so taking empirical results might sometimes be enough to compare effectiveness since you can have a hard time unraveling the true cost of operations in the backend, flash arrays, SSDs and tiered storage can make one type of operation equivalent to another in performance.
The least impact on the system was to use extended events. That does add observer overhead, but it’s extremely minimal. In general, it’s the safest approach. Plus, I was filtering it so it was only capturing events for a single session ID, further reducing any impact on the system.
The fastest overall query, when just looking at the query execution time, was the one where I had loaded and sorted the data in a temp table, but, that loading process actually made it one of the slower running queries. The fastest general query was to simply pass a table valued parameter. The data was unsorted, but overall, including any additional processing, the query ran faster and had less I/O than any of the others.
In my opinion, most business apps should treat extreme performance tuning with care. Generally, easier to maintain code should be favored over code that shaves a few nanoseconds off. Partly because time metrics are complex and partly because most people don’t force specific plans to run, but rather leave the plan up to SQL server.
So, that said, it’s my opinion that doing sane things will over time increase performance as you upgrade your application, since the people who write SQL server are way smarter than me.
Just my two cents.
Is this true of this type of performance measurement, or is this by design?
At the risk of asking a stupid question, why would SET STATISTICS IO cause a huge difference in performance? Doesn’t SQL Server keep track of IO data internally even if SET STATISTICS IO is not used? (If I execute a utility like sp_who3, it reports IO statistics for queries that were not executed with SET STATISTICS IO.)
Hey John,
It really comes down to what we’re looking at for tuning. A query that gets called 5-10 times an hour? No, I’m not going to try shaving milliseconds off it. A query that gets called 5-10 times a second? Yes. I’m sure going to try to find every way possible to make that thing faster.
By and large though, common sense and standard approaches are the right way to go. Fancy stuff is generally not needed most of the time.
Robert & Curt,
The problem is not the actual performance of the queries themselves, but the fact that the need to retrieve the I/O statistics with the query actually added overhead to the entire query execution time, even on the server. Removing that exposed the real execution times.
I wouldn’t say it’s “by design” so much as a simple artifact caused by requiring additional work.
Grant, no offense, but anything called 5-10 times per second might be better off seeing if you can stop calling it 5-10 times a second if you really want to performance tune. I have found anything reasonably fast should generally be left alone in favor of optimizing things that actually are harming user perception of system performance.
Regarding the overhead from SET STATISTICS IO ON/OFF, be aware that it will generally only show the stats from one level deep, so can be misleading, but it does give stats per table affected. If you only care about overall consumed time/resources, the DMV stats referred to by Curt may be more accurate. You can fetch that by asking SQL Server what the sys.dm_exec_sessions ( http://msdn.microsoft.com/en-us/library/ms176013.aspx ) says about your @@spid before and after your SQL executes. This method can also be used to “checkpoint” your overhead at specific spots if you are less concerned with the minutia, and more concerned with relative resource consumption. Note that this information is a tally of consumption so far, so should be subtracted from the starting values to derive the delta. In my opinion, tracking elapsed time is tricky to do correctly, and generally should be avoided in comparing performance gains. A fully quiesced system is difficult to achieve, but cycles of compute, memory, logical reads should generally be more revealing.
Thanks
In your final design, did you consider making the table variable clustered around the sort key/join-key? I find that really makes SQL Server 2008+ happy 🙂
CREATE TYPE [dbo].[SortedIDs] AS TABLE(
[ID] [bigint] NOT NULL,
[SomeOtherDataIfNeeded] [int] NOT NULL,
PRIMARY KEY CLUSTERED
(
[ID] ASC
)WITH (IGNORE_DUP_KEY = OFF)
)
Marc,
The fastest queries were the ones with sorted data. But, I didn’t want to pay the overhead of getting the data into a sorted state. However, just getting the data into a table valued parameter resulted in faster execution than the massive IN clause. In most cases, that would be good enough.
How did the cost (and especially duration) of compilation come into play with the various queries here Grant?
Had to rerun it all, but it was very low, 3ms, 5ms, 7ms, definitely not a major factor in any of the execution times for the various queries I was trying out. No surprises really. The queries, except for some of the funky ones where I was trying generating a table of numbers on the fly, were all very simple.
Interesting that the optimizer can create that big mess of a plan without much more delay than it incurs in creating the tiny plan!
I know I’m late for the show but I missed this article when it was published.
One of the best proofs of what you’re saying about complex v.s. simple execution plans can be seen if you’ve ever looked at the execution plan that is created during one of Itzek Ben-Gan’s wonderful cCTEs (“Cascading CTE”, just my name for it). Terribly complex execution plan but nasty fast code.
I also had the same “out of body” experience about how to measure the performance of code the same year that you did in this fine article and, like you, wrote about it. The article can be found here.
http://www.sqlservercentral.com/articles/T-SQL/91724/
Getting back to this article, keep up the awesome work, Grant. I’ve learned more from you than you’ll ever know.
Excellent! Thanks for sharing that one Jeff.
And thanks for the kind words. Right back at you.
[…] https://www.scarydba.com/2014/12/19/pretty-plans-vs-performance/ […]